

Co-sail Petroleum

Beijing C0-Sail Petroleum Technology Co.Ltd
Room C1006A, Century Science and Trade Building, No. 66, Zhongguancun East Road, Haidian District, Beijing,China(100190)
Tel:(8610)-82612930
E-mail:market@co-sail.com
The application of image monitoring technology of micro fracture
Oil(gas, coal) field fracture monitoring.
Development area dynamic fracture monitoring, etc.
Unconventional oil & gas(shale) micro fracture monitoring.
Technology Overview
A vector scanning of emission energy specially for smaller signal over noise (S/N) is used in our microseismic imaging, which breaks the S/N limits in the data processing for conventional relocation and be able to monitor the microseismicity even though there exists shear characteristics in the events.
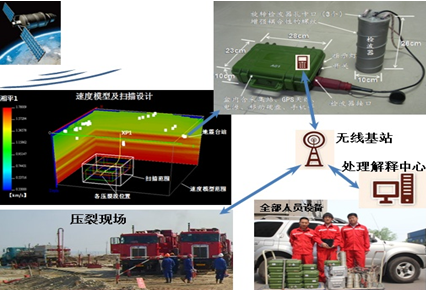
The following conditions for our special seismic instruments have been satisfied: 1) 3-component sensor screwed into ground for being well coupled with land; 2) Each is controlled by GPS independently without the limit from topography; 3) After determining 20-30 quiet points for stations in a square of more than 10 km2 using a specially prospecting instrument for background noise, the network can be quickly constructed in several hours on surface;
In data processing, we suppress and/or remove variety of interference records without respect to the fracturing raptures. The vector scanning relies on a velocity model, and corresponding travel time and incident geometry tables between each pair of station and scanning point for whole target volume. Therefore, we have to interpolate a velocity model as closer as possible to real one by using available sonic measurements and exploration outputs, even some of ourselves measurements. Making the velocity model constructs, first, a 3D curved surface or topography if the target region is a mountain or loess tableland. A geometrical design consists of making velocity model, calculating travel time table, and determining correct positions of fracturing stages based on the deviated data of a well.
Both the data processing and interpretation are performed in high speed cloud calculation for real time monitoring.
The figure shows our special instruments, seismic network, survey design, and people for data acquisition.
Application and the evaluation of the reliability
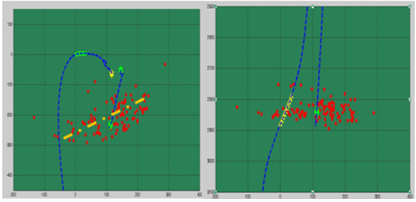
Example 1: The validation of the vector scanning method using known production data,the 2D fracture energy distributions of monitoring fracturing for well B660-20. Left: horizontal plane at a depth of2920 m. Right: vertical section across the wells. Black squares are the wells at the corresponding depths. Well B660-19 erupted when well B660-20 was being fractured. Both are vertical well.
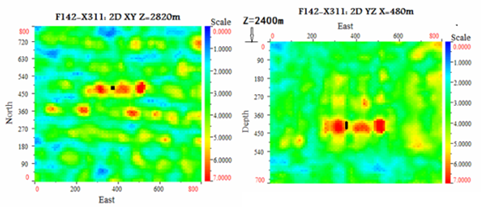
Example 2:Comparisonbetween the vector scanning (the bottom row with fracture energy distribution)and the seismic monitoring in a well and close to fracturing segment (the upperrow with fracture points located) , for well F142-X311. The left column showsthe fracture projection onto the horizontal plane; and the right column showsthe projection as a vertical cross-section oriented easterly. Both planesmeasured the HF, and processed and interpreted independently. The outputs aretabulated to show as the Table.
Description of the hydro-fracture in values corresponding to Figure
|
Methods |
Orientation(degrees) |
Length(m) |
Geometry |
|
Down-hole |
NE75 |
240 |
Symmetric two wings |
|
Vector scanning on surface |
NE85 |
200-300 |
Symmetric two wings |

The scanning progress with respect to the data processing in example 2, the color maps show the different energy distribution according to the time variation, the red indicates higher energy, the blue for lower energy. The black dot shows the point of the fracture. Their combination is just the final fracture in the down left sub-figure of the figure above.
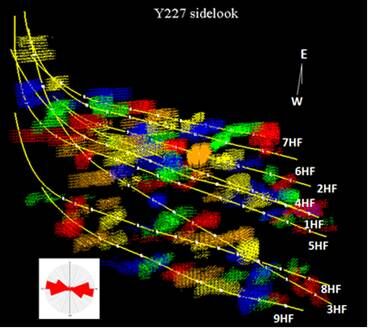
Example 3:The application using vector scanning in HF for horizontal wells in block Y227, It is side-look distribution of the greater released fracturing energy for 9 wells. Well trajectories are displayed as yellow. The colored dots close to each stage (white point) show the high fracturing energy in 3D. The different colors are here only for identification among the stages. A sub-figure at lower left corner shows the statistical orientations of the all interpreted fractures.
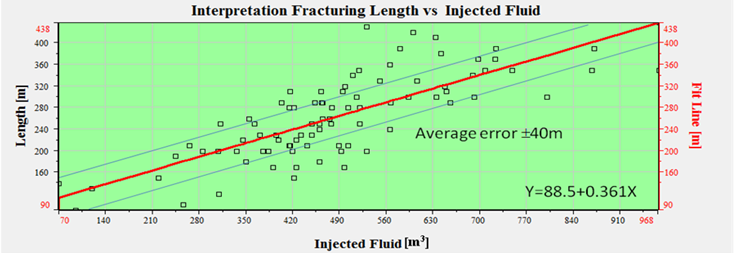
A relationship between the interpreted fracture lengths (black squares) and the injected volumes, a red line for fitting data shows a relationship between them. This relationship is significant for fracturing, development of block Y227, and even possibly general sand gravel reservoirs.